Live Postgres dashboards in 60s
AI turns your Postgres data into SaaS dashboard instantly: signups, activation, revenue, and churn


From Postgres to a live dashboard in 60 seconds
No BI project. No data team. Just connect your database and see the metrics your startup actually needs.
- 1. Link your Postgres database
Works with Supabase, Neon, RDS, Render, Railway, and more. Takes about 30 seconds.
- 2. See your first charts
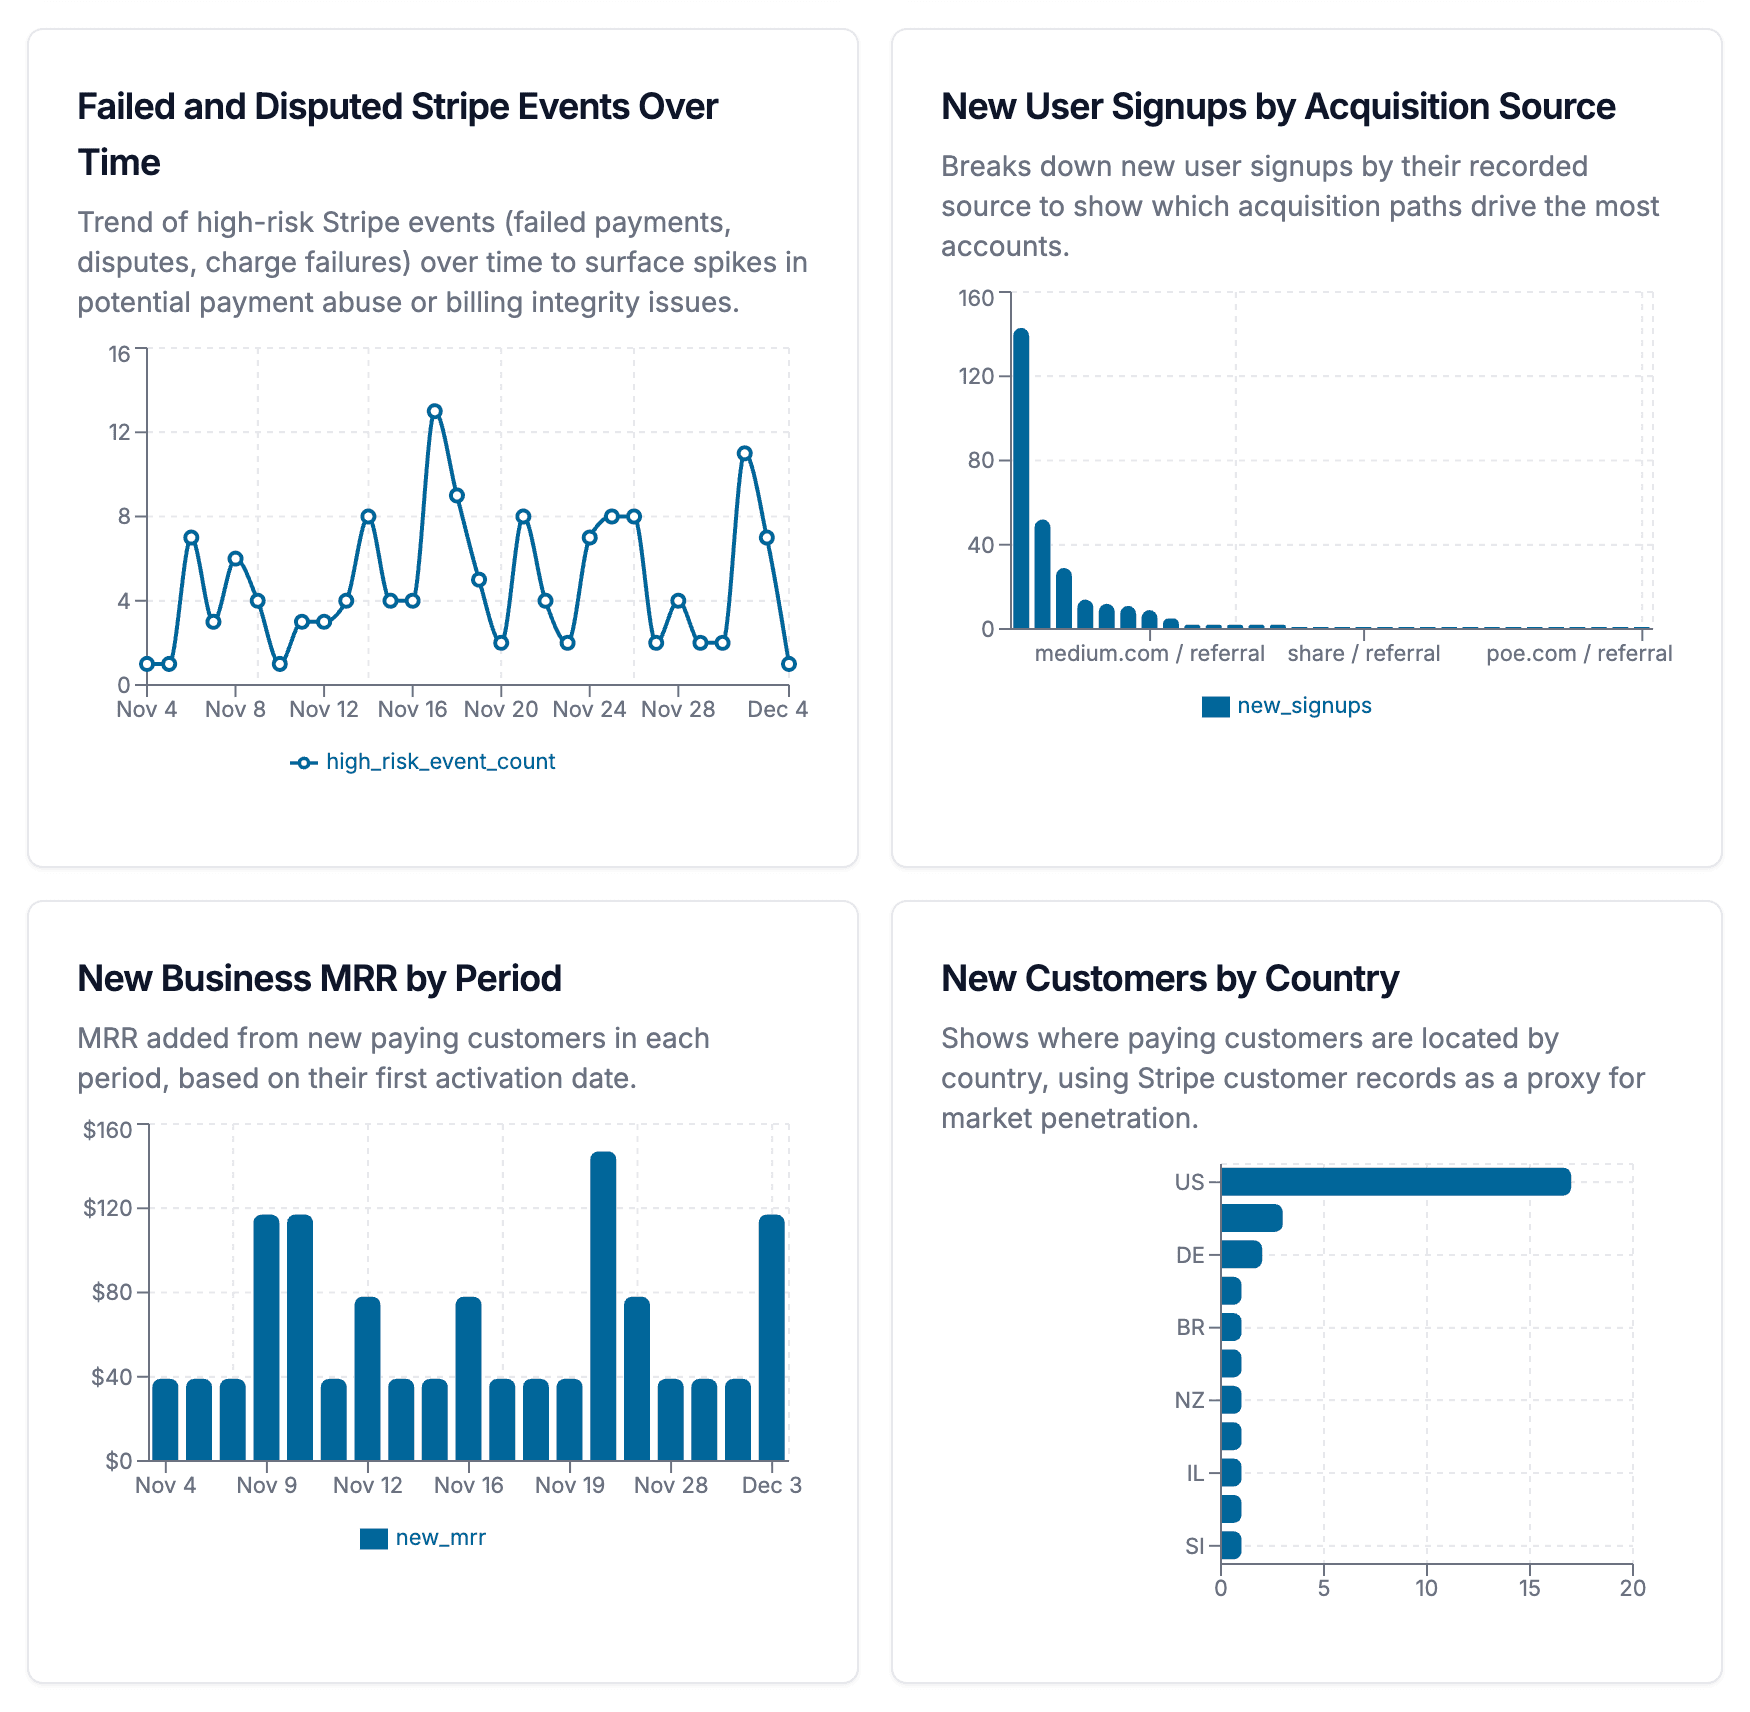
AI reads your schema and builds a dashboard with the metrics that matter: growth, revenue, retention.
- 3. Share with your team
Preview a few charts free. Upgrade to unlock everything, invite teammates, and export for your next board meeting.
The metrics founders actually need
Not a generic BI tool. Lenstide is built specifically for SaaS startups on Postgres, with the charts investors ask about.
- Know your numbers without building anything:
- Signups, activation, revenue, and churn charts appear automatically. No modeling, no events, no SQL.
- Track revenue trends at a glance:
- MRR growth, failed payments, recovery rates, and churn by cohort. Spot problems before they compound.
- Find where users drop off:
- See which onboarding steps lose people, which features get ignored, and where activation stalls.
- Ask questions in plain English:
- "Why did signups drop last Tuesday?" Get an explanation and a chart you can share with the team.
- Share with investors and teammates:
- Send a live link instead of screenshots. Export to PDF for board decks. Set up alerts so you never miss a spike.
- Your database stays safe:
- Read-only connections only. We never write to your database. Connect a replica if you prefer.
Built for early-stage SaaS teams
You have a product to build. Let Lenstide handle the metrics so you can focus on what matters.
- Your team keeps asking for dashboards but you have features to ship. Connect Lenstide once and stop being the bottleneck for every data question.
- Your investor asked about churn and you had to wing it. Next time, send them a live dashboard link instead of a screenshot from a spreadsheet.
- You need to know where users drop off, but getting that data means waiting on engineering. Ask Lenstide in plain English and get the chart in seconds.
- MRR, failed payments, churn by cohort. The numbers you need for forecasting and board decks, updated automatically instead of manually pulled each month.
Frequently asked questions
- Can I try it before paying?
Yes. Add your database and you'll see a preview of your dashboard with a few charts fully visible. No credit card required to try it.
- How much does it cost?
$49 / month for everything: all charts, exports, AI chat, alerts, and unlimited teammates. No per-seat pricing, no surprise charges. See plan details
- How does Lenstide access my database?
We use read-only database connections with the credentials you provide. We recommend creating a dedicated read-only database user. We never write to your database, and you can revoke access at any time by changing your credentials.
- Will this slow down my database?
No. We use read-only connections and optimized queries with sampling. Most queries complete in under a second. You can also connect to a read replica instead of your primary database.
- Is my data safe?
Yes. We never store your raw data—only aggregated chart results. Database credentials are encrypted at rest. All connections use SSL/TLS encryption. We're a US-based company (Lifehack Labs LLC, Austin TX) and take data security seriously. Questions? Contact us
- What if my schema is unusual?
Lenstide works best with typical SaaS schemas (users, subscriptions, events). If your schema is non-standard, the AI will do its best, and you can always ask for specific charts in the chat.
- Can I cancel anytime?
Yes. Cancel with one click and keep access until the end of your billing period. No contracts, no cancellation fees.
See your metrics in under a minute
Get a live, shareable dashboard automatically